




Statistical analysis plays an important role in academic research because it helps researchers understand data, identify patterns, and draw meaningful conclusions. Among the most commonly used statistical techniques are correlation and regression analysis. Both methods help examine relationships between variables, but they serve different purposes.
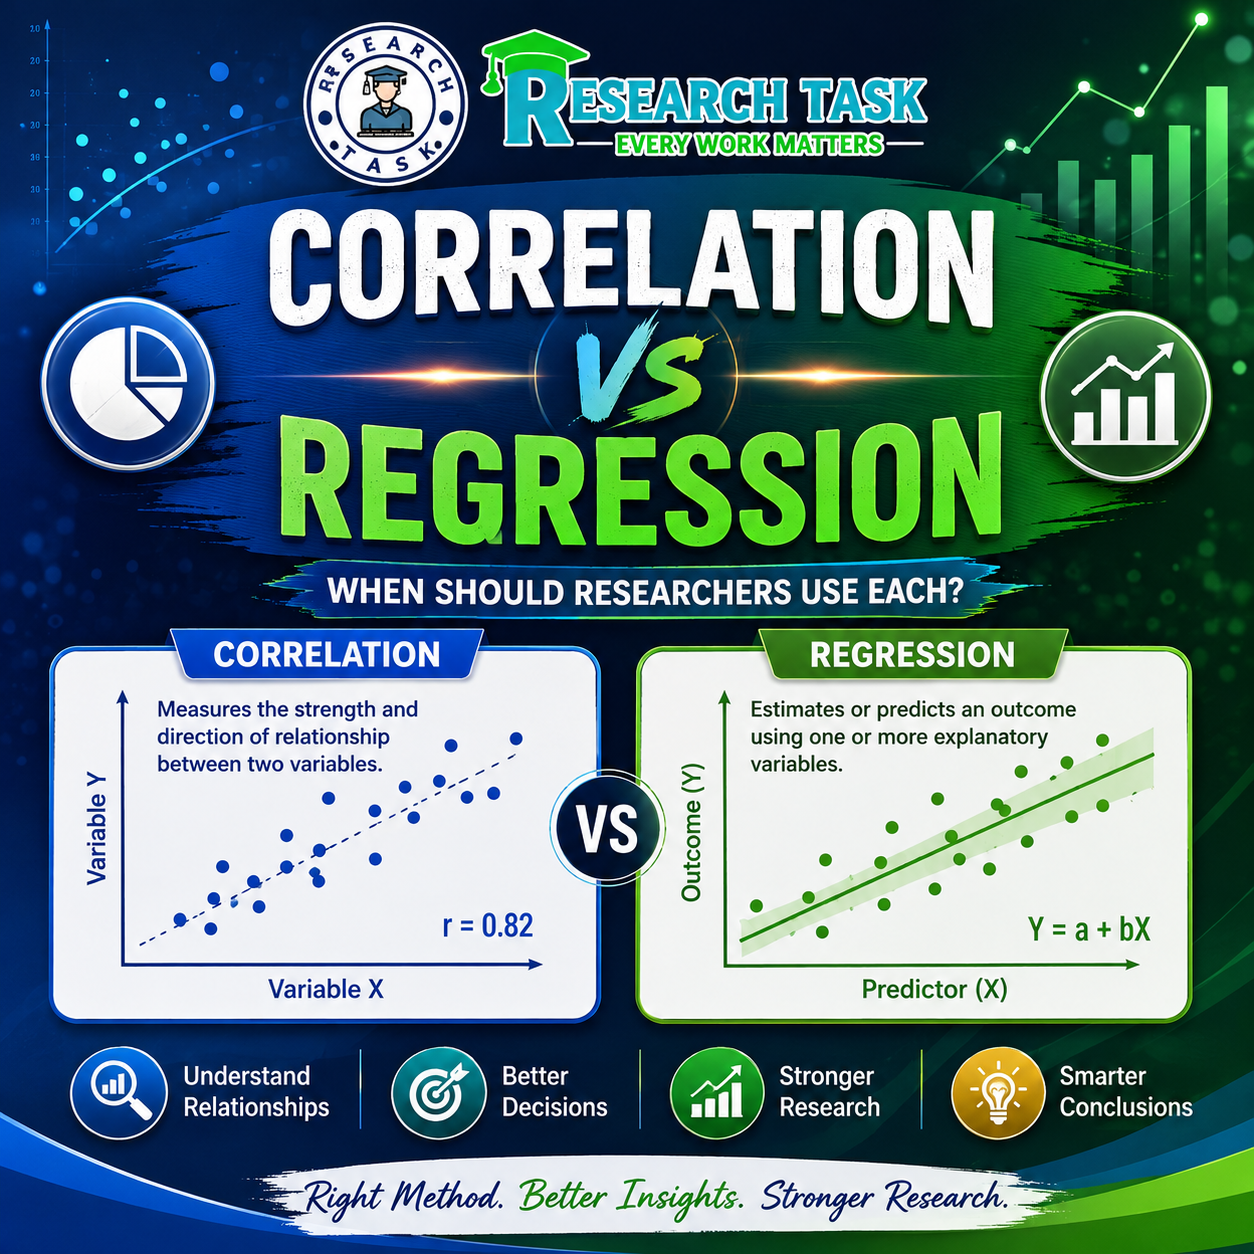
Understanding correlation vs regression analysis is essential for students, PhD scholars, and researchers who want to select the appropriate statistical method for their research objectives. While correlation measures the strength and direction of a relationship between two variables, regression analysis examines how an outcome variable relates to one or more explanatory variables and can be used to estimate or predict outcomes.
In this guide, we will explain the key differences between correlation and regression, provide practical examples, and discuss when researchers should use each method.
What Is Correlation Analysis?
Correlation analysis is a statistical method used to measure the strength and direction of the relationship between two variables. It helps researchers determine whether changes in one variable are associated with changes in another.
The Pearson correlation coefficient, represented by r, is commonly used to measure linear relationships between numerical variables. Its value ranges from -1 to +1.
- Positive correlation: Both variables tend to increase or decrease together.
- Negative correlation: One variable tends to increase as the other decreases.
- Zero correlation: No linear relationship is detected between the variables.
For example, a researcher may investigate the relationship between students’ study hours and examination scores. If students who study more hours generally achieve higher scores, the variables may have a positive correlation.
However, correlation does not establish that one variable causes changes in another. Other factors, such as prior knowledge, teaching quality, and learning resources, may also influence examination performance.
When Should Researchers Use Correlation Analysis?
Correlation analysis is suitable when researchers want to:
- Measure the strength and direction of relationships between variables.
- Explore associations before conducting more advanced statistical analysis.
- Examine relationships between questionnaire responses and numerical measurements.
- Identify patterns in educational, psychological, medical, and social science research.
- Test hypotheses about associations between variables.
Researchers should also consider the type and distribution of their data. For example, Spearman’s rank correlation may be more appropriate for ordinal data or certain monotonic relationships when Pearson correlation assumptions are unsuitable.
What Is Regression Analysis?
Regression analysis is a statistical technique used to examine how an outcome variable is associated with one or more explanatory variables. It can estimate the expected value of an outcome, quantify relationships, and support predictions.
In simple linear regression, researchers examine the relationship between one predictor and one outcome variable. Multiple regression extends this approach to include several predictors.
For example, a researcher studying student performance may examine how study hours, attendance, and previous examination scores relate to final examination results. Regression analysis can estimate the association between each predictor and the outcome while accounting for the other included predictors.
The results depend on the selected model, its assumptions, and the quality of the data. Regression alone does not prove a causal relationship.
When Should Researchers Use Regression Analysis?
Regression analysis is useful when researchers want to:
- Estimate the relationship between explanatory variables and an outcome.
- Predict outcomes using one or more predictors.
- Examine the association between a particular variable and an outcome while adjusting for other variables.
- Evaluate hypotheses involving multiple explanatory variables.
- Analyse research data for a thesis, dissertation, or journal paper.
The appropriate regression method depends on the outcome variable. Linear regression is often used for continuous outcomes, while logistic regression is commonly used for binary outcomes.
Correlation vs Regression Analysis: Key Differences
Although correlation and regression both investigate relationships between variables, their objectives and interpretations differ.
| Basis of comparison | Correlation analysis | Regression analysis |
| Main purpose | Measures the strength and direction of an association | Estimates or predicts an outcome using explanatory variables |
| Variable roles | Treats the variables symmetrically | Distinguishes between outcome and predictor variables |
| Results | Produces a correlation coefficient | Produces model coefficients, predictions, and other statistics |
| Range of results | Pearson’s r ranges from -1 to +1 | Coefficients can take a wide range of values |
| Prediction | Does not directly provide a prediction model | Can be used to estimate and predict outcomes |
| Multiple variables | Can examine pairs of variables or use multivariable correlation methods | Can include multiple predictors in a single model |
| Common applications | Exploring associations and testing relationships | Prediction, estimation, and adjusted analysis |
The main distinction is that correlation describes an association, whereas regression models an outcome in relation to one or more predictors.
Practical Examples of Correlation and Regression Analysis
Consider a researcher investigating the relationship between study habits and academic performance.
Example 1: Using correlation analysis
The researcher collects data on weekly study hours and examination scores from 100 students. The objective is to determine whether students who study for longer periods tend to achieve higher marks.
Correlation analysis can show the direction and strength of the linear association between the two variables. A positive coefficient would indicate that higher study hours tend to be associated with higher examination scores.
Example 2: Using regression analysis
The researcher wants to estimate examination scores using study hours, attendance, and previous academic performance.
A multiple regression model can estimate the relationship between each predictor and examination scores while holding the other included predictors constant. It can also generate predicted scores for specified values of the predictors.
These examples demonstrate that the choice of method should depend on the research question rather than simply the availability of statistical software.
How to Choose the Right Statistical Method for Your Research
Selecting between correlation and regression analysis becomes easier when researchers clearly define their objectives.
1. Identify Your Research Objective
If your primary goal is to determine whether two variables are associated, correlation analysis may be appropriate. If you want to estimate an outcome or examine how several predictors relate to it, regression analysis may be more suitable.
2. Identify the Type of Variables
Consider whether your variables are continuous, ordinal, binary, or categorical. Pearson correlation is commonly used for linear relationships between numerical variables, while Spearman correlation may suit ranked or ordinal data. Regression models should be selected according to the outcome type and research design.
3. Check Statistical Assumptions
Pearson correlation and ordinary least-squares linear regression have assumptions that researchers should evaluate. Depending on the method, these may include linearity, independence, appropriate residual behaviour, and the absence of problematic multicollinearity in multiple regression.
4. Consider the Number of Variables
Correlation can help examine pairwise relationships. Regression is particularly useful when the analysis requires multiple predictors or adjustment for potential confounding variables.
5. Interpret Results in Context
Statistical results should be interpreted alongside the research design, sample size, data quality, and limitations. A statistically significant result does not necessarily indicate a strong or practically important relationship.
Common Mistakes to Avoid
Researchers should avoid several common errors when conducting correlation or regression analysis:
- Assuming that correlation proves causation.
- Selecting a statistical method without considering the research question.
- Ignoring assumptions and data quality.
- Interpreting statistical significance as proof of practical importance.
- Using regression predictions outside the range of the observed data without sufficient justification.
- Reporting coefficients without explaining their meaning in the research context.
Avoiding these mistakes improves the reliability and clarity of statistical findings.
Can Researchers Use Correlation and Regression Together?
Yes. Correlation and regression can complement each other in the same research project.
Researchers may begin with correlation analysis to explore associations between variables. They can then use regression analysis to investigate a particular outcome, account for additional predictors, and estimate adjusted relationships.
However, correlation analysis is not a mandatory preliminary step for every regression model. The research question, study design, and analytical plan should determine the methods used.
Software such as SPSS, R, Python, and Stata can support both techniques. Researchers should select software according to their data, analytical requirements, and familiarity with the available tools.
Conclusion
Correlation and regression analysis are important statistical methods, but they answer different research questions. Correlation measures the strength and direction of an association between variables, while regression examines how an outcome relates to one or more predictors and can support estimation and prediction.
For researchers working on dissertations, PhD theses, or academic publications, selecting the appropriate method is an essential part of producing meaningful results. By understanding the research objective, variable types, and statistical assumptions, researchers can choose a suitable analytical approach and interpret their findings more accurately.
ResearchTask supports researchers in understanding research methodology and statistical analysis so they can approach academic projects with greater clarity and confidence.
Frequently Asked Questions
1. What is the main difference between correlation and regression analysis?
Correlation measures the strength and direction of an association between variables. Regression models the relationship between an outcome and one or more predictors, often to estimate or predict the outcome.
2. When should researchers use correlation analysis?
Researchers should consider correlation analysis when they want to measure the strength and direction of an association between two variables without assigning one variable the role of an outcome to be predicted.
3. When is regression analysis more appropriate?
Regression is useful when researchers want to estimate an outcome using one or more predictors, generate predictions, or examine adjusted associations while accounting for additional variables.
4. Does correlation prove causation?
No. Correlation indicates an association but does not establish that one variable causes another. Causal conclusions require an appropriate research design and additional supporting evidence.
5. Can correlation and regression be used in the same study?
Yes. Researchers can use correlation to explore associations and regression to examine specific outcomes or adjust for other variables, provided both methods align with the research objectives.
6. Which software can be used for correlation and regression analysis?
SPSS, R, Python, and Stata are commonly used for these statistical techniques. The best choice depends on the research design, data, analytical requirements, and researcher expertise.